The Results

What you see after testing.

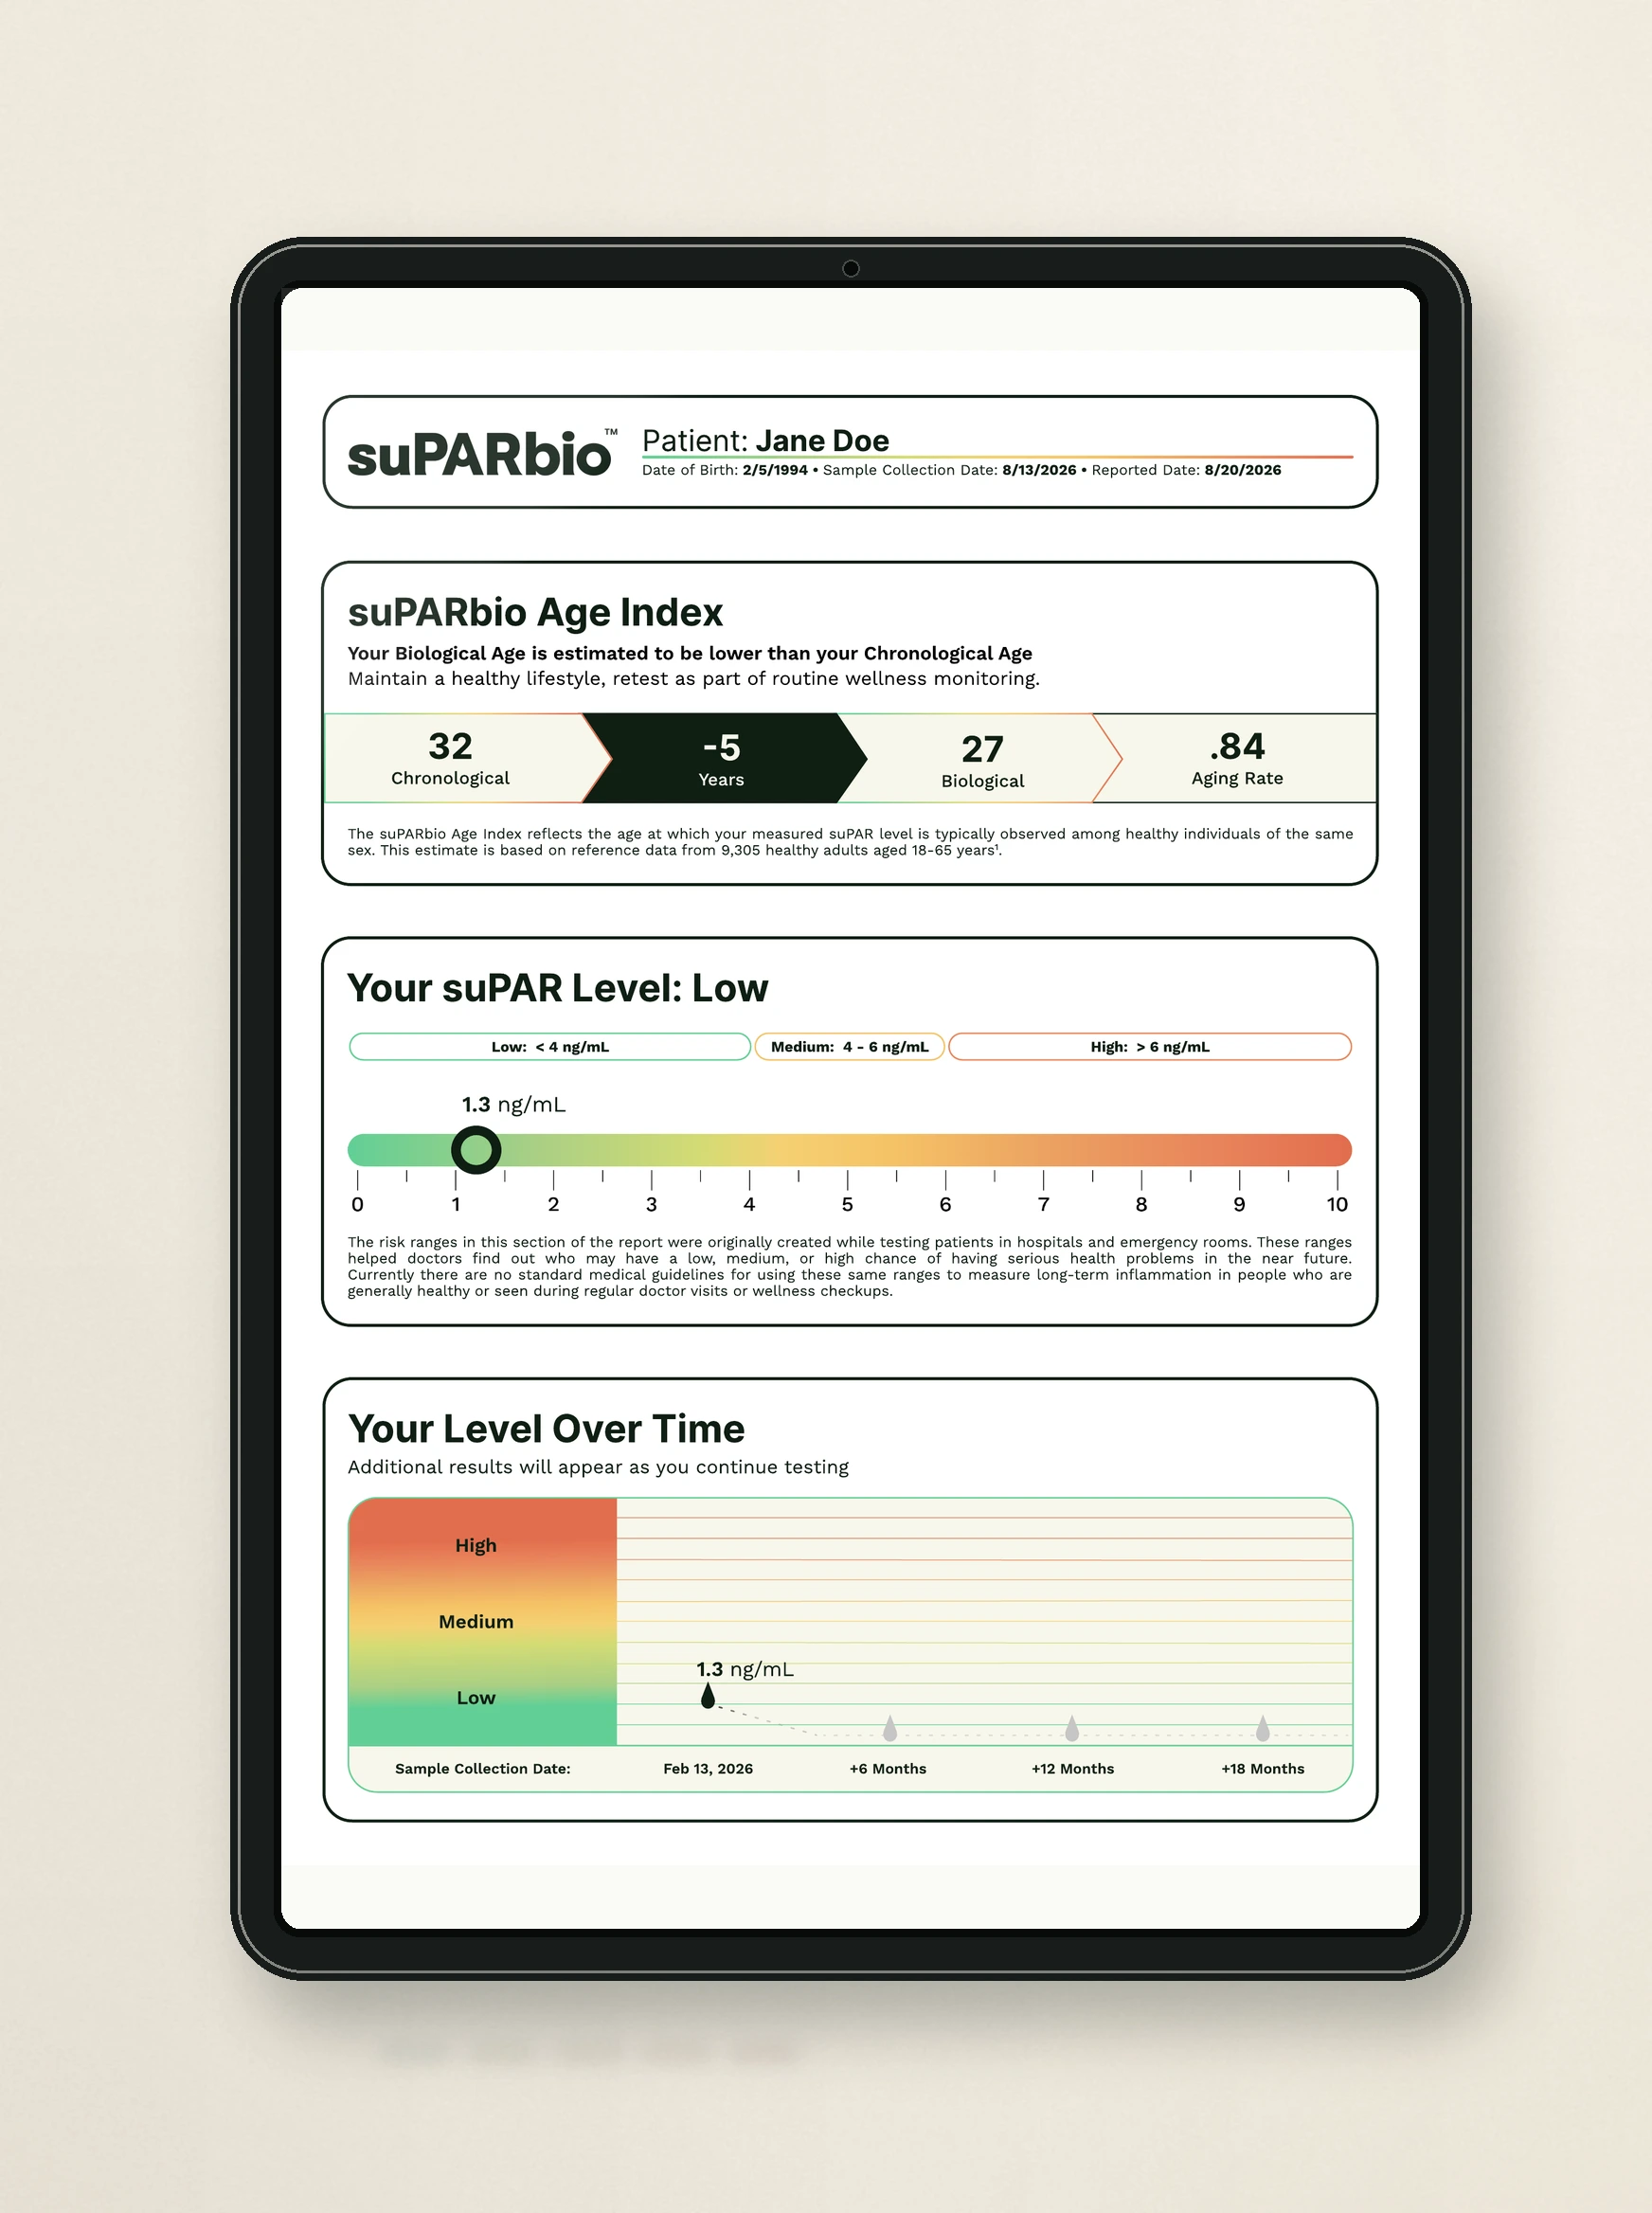
Your result is delivered in your suPAR Bio dashboard. Each section is annotated with context and the report can be downloaded as a PDF.

  • suPARbio Age Index. A calculated indicator that compares your estimated biological age with your chronological age.
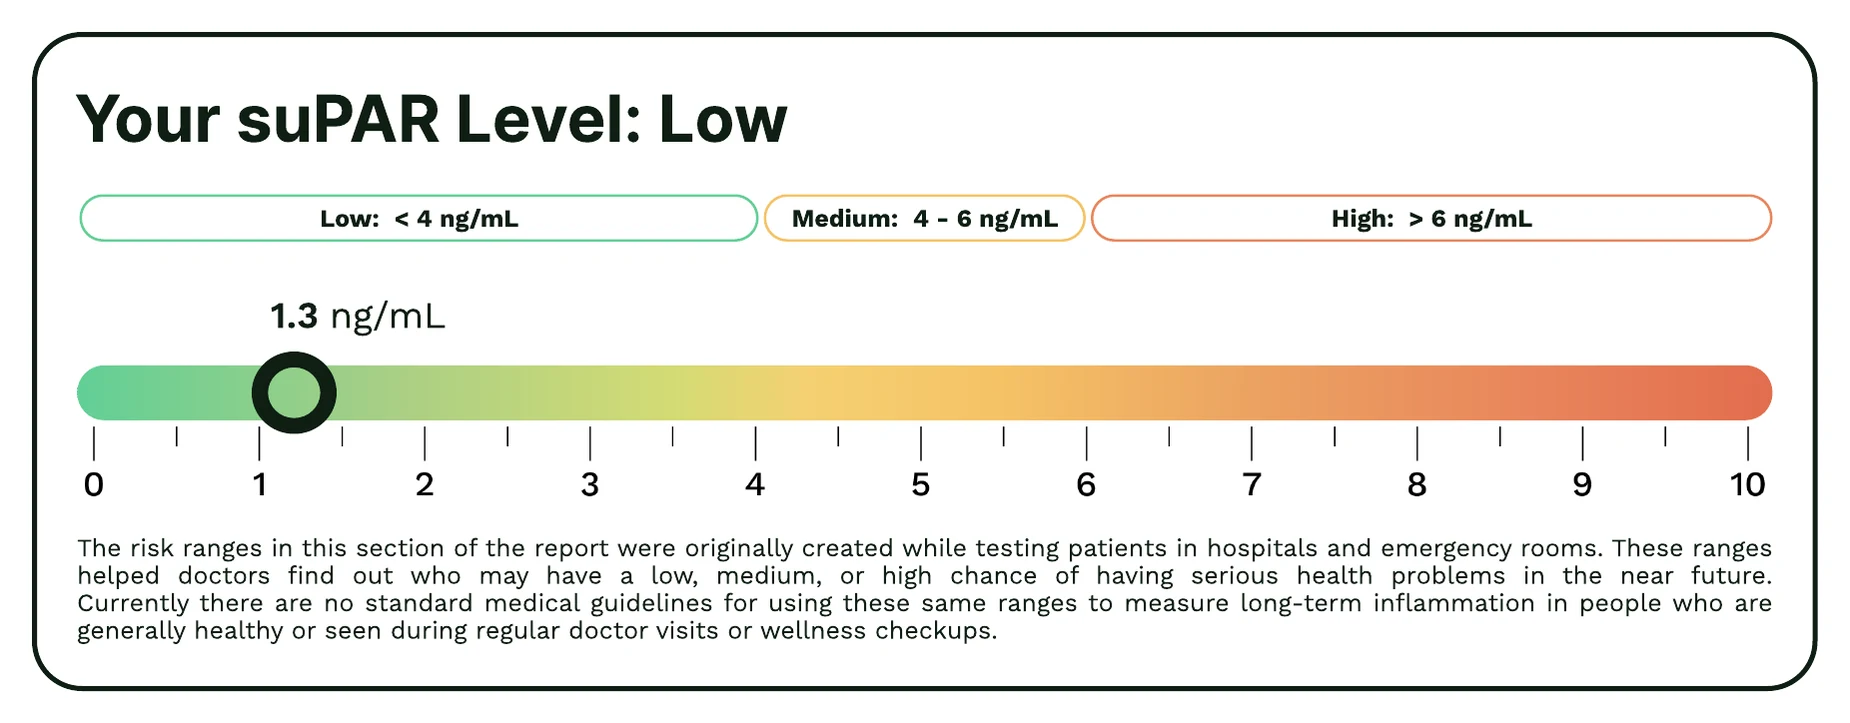
  • suPAR level. The concentration of suPAR in the blood, measured in ng/mL.
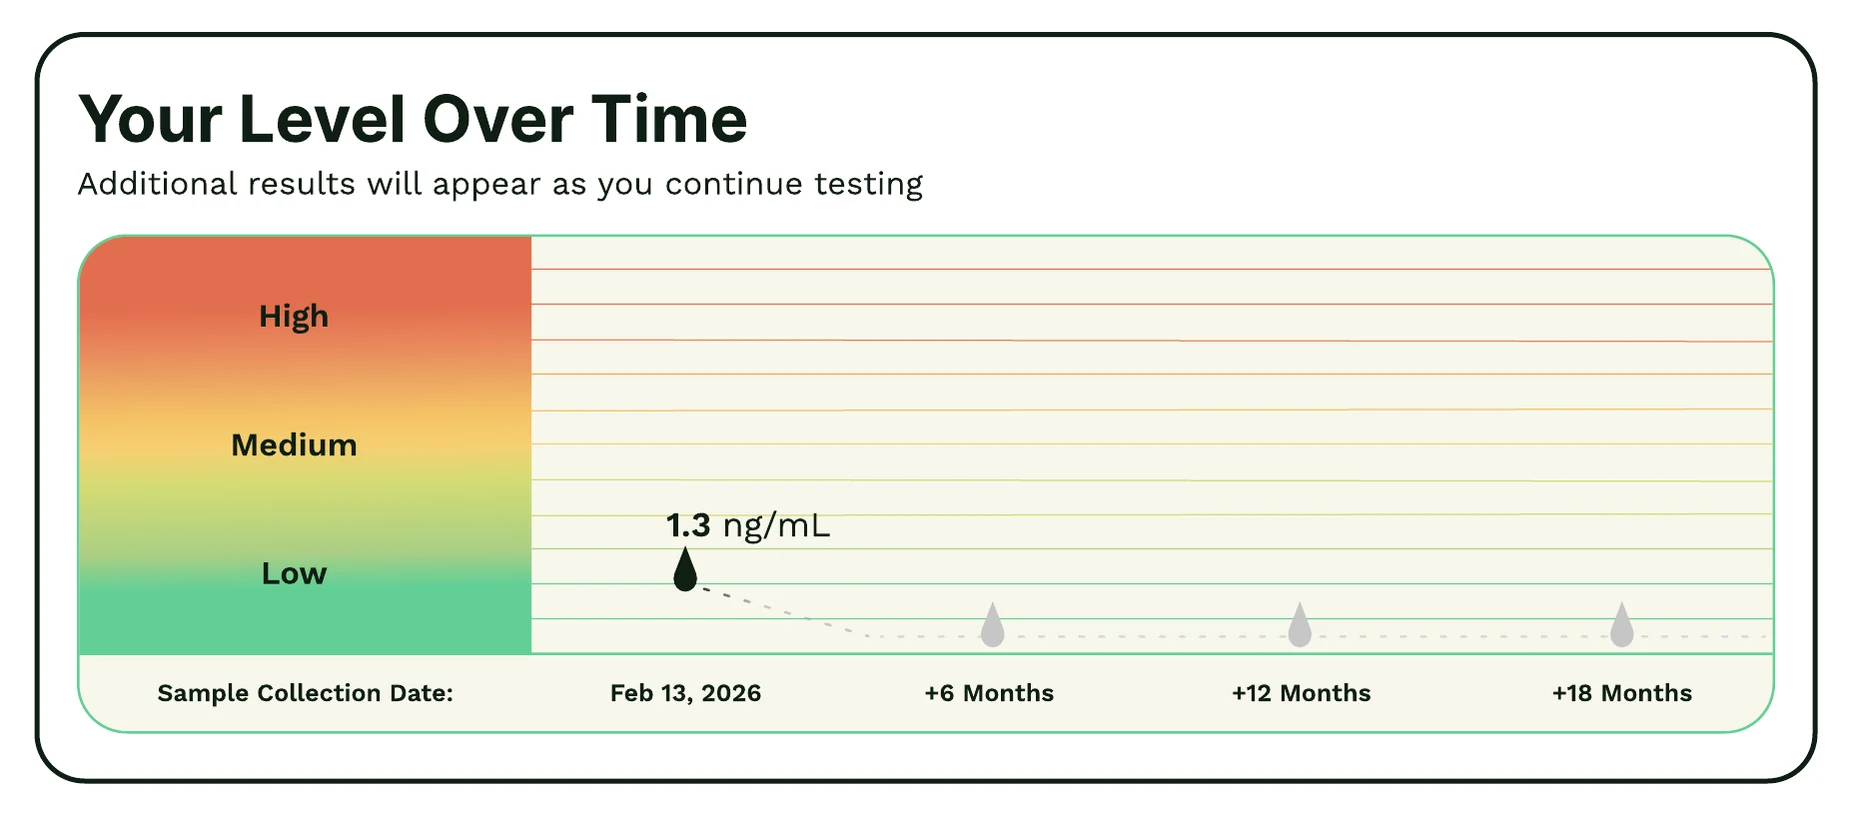
  • Level over time. A longitudinal trend of repeat test results, providing greater context over time.
The approved suPAR Bio sample results report displayed on a vertical iPad-style screen.

suPARbio Age Index

A statistical estimate, not a verdict.

The suPARbio Age Index compares your suPAR level with healthy individuals of the same sex to provide additional context for your result. It is not a diagnosis or a direct measure of biological age.
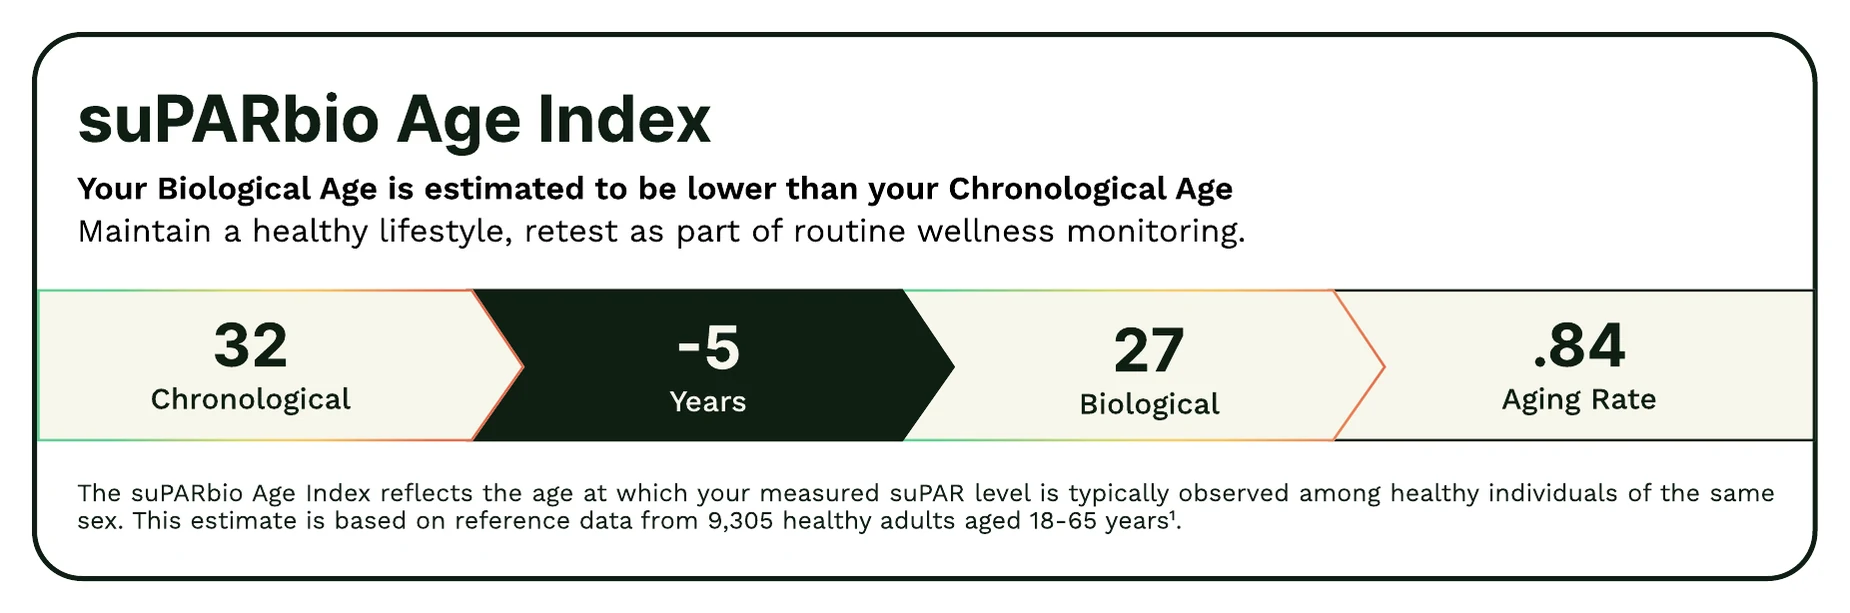
The approved suPARbio Age Index report module.

Reference-based, sex-adjusted context for understanding your result.

  • Reference-based. Built from population-level reference data.
  • Sex-adjusted. Uses separate curves for men and women.
  • Transparent range. The reference cohort is Northern European, and the report says so.
suPAR level

The measured value, shown with its range.

The suPAR level is the measured concentration in ng/mL and its associated range, which may indicate the likelihood of serious health events in the near future.

The approved suPAR level report module.

A current measurement with its unit and reporting band kept visible together.

  • Measured in ng/mL. The report keeps the unit visible next to the value.
  • Band context. The value is shown against the report's low, medium, and high ranges.
  • One data point. The level is a measurement, not a diagnosis.

Level over time

Track how your suPAR level changes with repeat testing.

Each new test adds another point, making it easier to see whether your suPAR level is staying stable or changing over time.

The approved suPAR Bio level-over-time report module.

Repeat results can be viewed on the same scale over time.

  • One point in time. Your first result reflects your suPAR level at the time of testing.
  • Meaningful trends. Repeat testing helps show whether your suPAR level remains stable or changes over weeks and months.
  • Reference categories. Results are displayed on the same Low / Medium / High scale so changes can be viewed consistently over time.

Boundaries

What this report is not.

The suPARbio™ Systemic Chronic Inflammation Test is not a diagnosis, a prediction of any specific disease, or a recommendation to start, stop, or change any medication. If your suPARbio Age Index suggests accelerated biological aging or your suPAR level falls within the Medium or High range, consider discussing your results with a qualified healthcare provider. This report is designed to support that conversation by providing additional context—not to replace clinical judgment.